Design environment
The user creates a processing package or task flow hierarchy using graphical elements (blocks) by dragging them from the Toolbox panel to the workspace, and then connects them to each other at the input and output port locations - input ports are customarily at the top, while output ports are at the bottom of the activity.
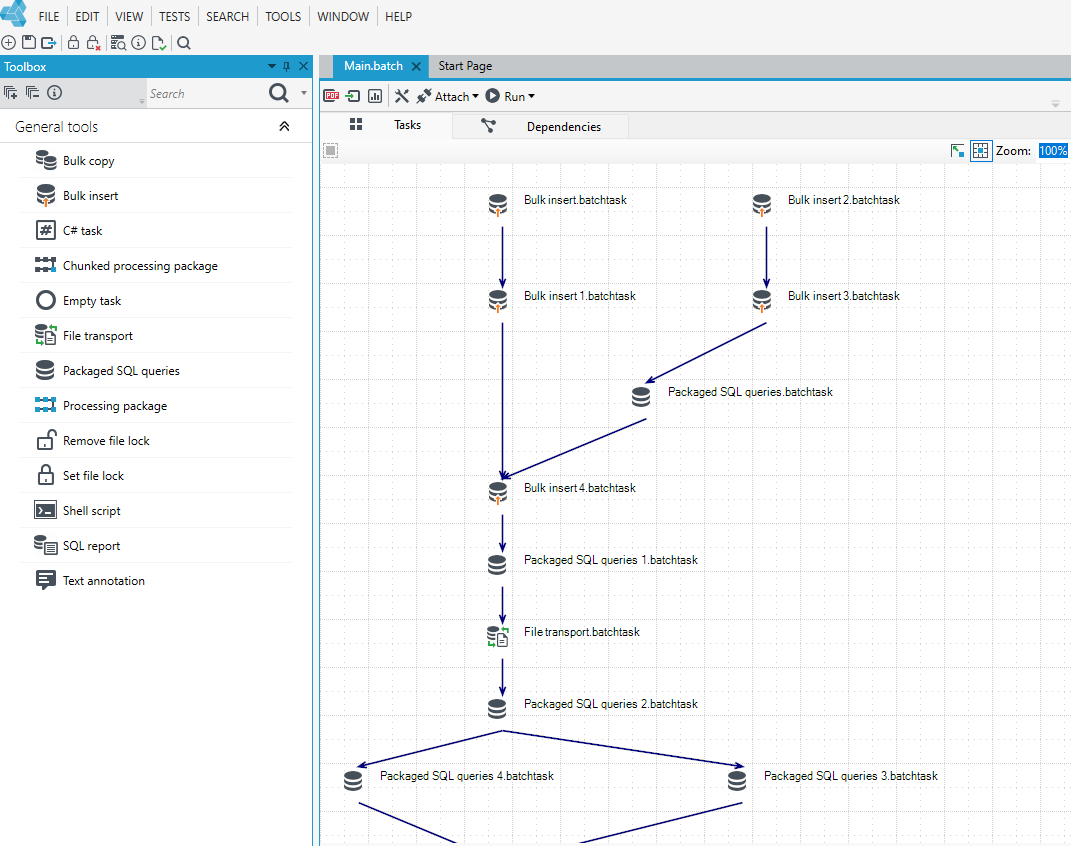
Below, the Toolbox panel and the workspace of the task hierarchy.
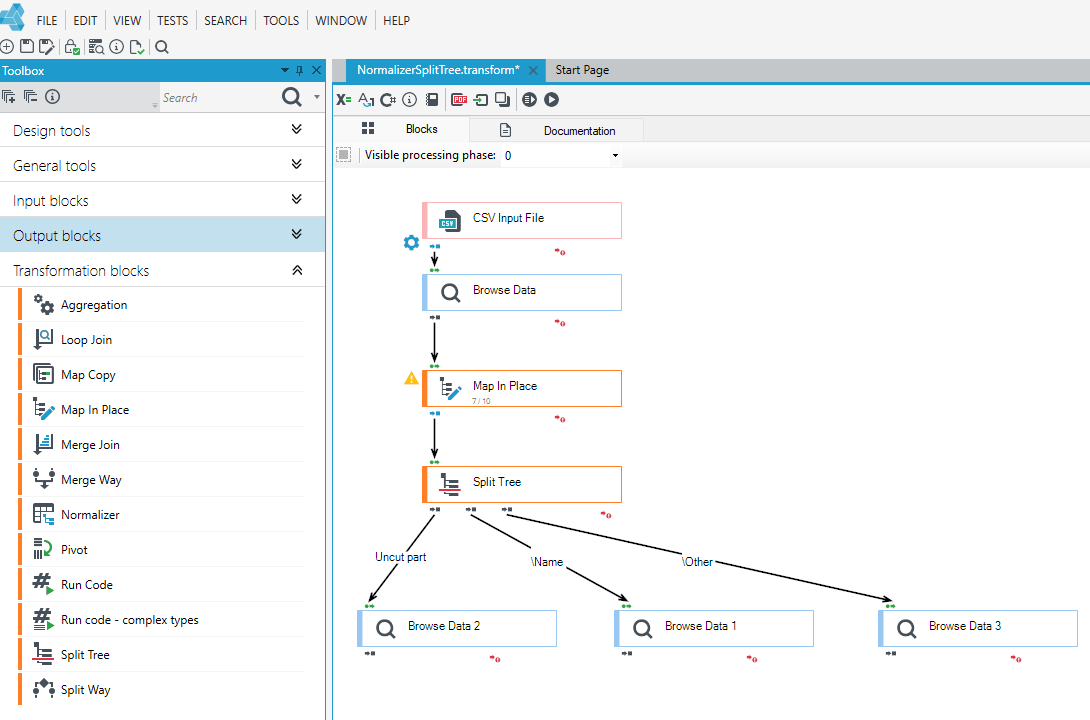
In the case of processing packages, there are more blocks available on the Toolbox tab, which have been grouped together.
Depending on the type of item the User is working on, the System provides different menu items specific to different types of files: Package and Hierarchy.
When working with a Mass Data Processing package, menu items specific to that type of file are visible.
When managing a hierarchy, menu items specific to that type of file are available.
Task Hierarchy Editor
Task Hierarchy Editor (.xml files) contains the Tasks, Report and Dependencies tab.
It enables not only files to be edited but also logs to be loaded.
- The tab Tasks shows items (tasks) and connections between them (dependencies). Direction of the arrow means the direction of the task control flow. Preceding tasks are usually placed higher and succeeding tasks are placed beneath them.
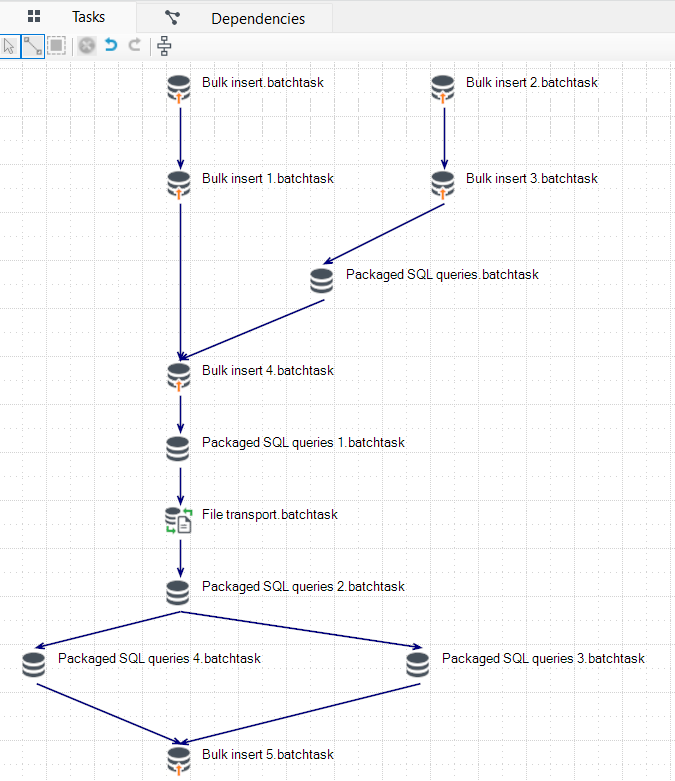
Tasks are placed in a hierarchy by dragging them from the toolbox.
Parallel execution
Tasks in the System may very often be executed parallel – only if there are no logical dependencies between them.
- On the task graph, it looks like a path fork (going up-down).
- However, actual number of tasks performed parallel will depend on the configuration on the side of the executive server where the maximum number of the task processing threads should be specified.
Log analysis
Apart from task definitions, the tab may display the processing state after execution on the basis of logs / SQL dump from the TASKS table or during execution (performing a query on the TASKS table every few seconds).
Log loading is available in the menu Hierarchy> Load logs/TASKS (it is allowed to select many files, e.g. using the Ctrl or Shift keys).
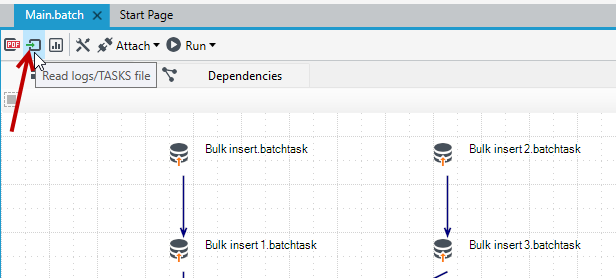
- Log loading means retrieving all possible information about processing the hierarchy tasks and presenting them in the graphical form.
- Additionally, logs which size is less than 1MB may be previewed in the Log panel (an output which name is the same as the one of the loaded file should be selected).
- Selecting Attach to database allows connecting to a database (the currently selected environments of databases defined in the database panel are available).
In the Show log mode, a desired ID of the Displayed batch ID may be used. By default, the largest ID found in data will be set.
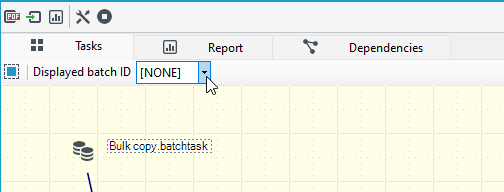
In this mode:
- the Properties panel displays the details of not only task definition but also task execution (start time, stop time, message, status, etc.) or several executions (if a task was repeated),
- colored rectangles appear around the task icons. The green one indicates the task is completed. The red one means the task was stopped erroneously. The yellow one indicates the task being processed. The blue one indicates one of the "PENDING" states. Bold borders mean multiple repetition of a task.
- selecting a specific task on a graph will result in an attempt to locate information about it in a loaded log file (the Log panel). If a file size exceeds 1 MB, only a fragment of the log (from the task start point to the task end point) will be dynamically displayed in the panel. If information about task end point is not found (e.g. a task is still in progress) a log fragment of 0,5 MB will be displayed.
An empty batch (cycle) ID should be selected in the top menu in order to leave the Show Log mode and to come back to task definitions browsing.
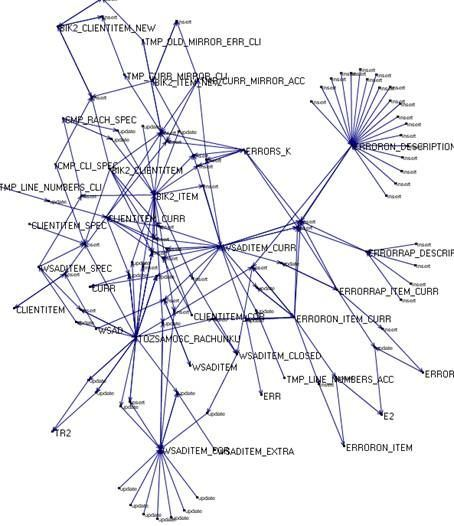
The Dependencies tab displays the graph of dependencies between SQL objects. The System is able to do it because it has a fairly complete SQL query parser. There are two kinds of nodes on the graph:
- SQL object (table, view, file) - data container,
- Operation - INSERT, UPDATE, processing package, LOAD. Double click moves to an appropriate task which defines the operation (the Task dependencies tab).
Immediately after the analysis of dependencies, the graph's arrangement is illegible. In order to make it clearer (to try to planarize it), the System uses an impressive force simulation algorithm.
Such graphical analysis seems to be indispensable when a large set of unclear SQL commands is given and they should be used to build a System (after understanding the principles of operation).
Data Transformation Editor
Data Transformation Editor is a proper package editor (.transform files).
- A package is created by arranging proper flows of the operation using appropriate blocks. The blocks for data management are available in the Toolbox tab (see: Blocks).
- The User may select a block in particular sections of the Toolbox tab and arrange them in the editor window using the drag and drop technique. It allows the User to perform certain operations using a single mouse movement.
- The package blocks must be connected with one another using directed connectors. The block input and output ports of two blocks are connected. The operation is performed by a single mouse movement.
- Adding the operation (represented by a block) to a package is also possible using the context menu of the connectors.
In order to do it:
- the Insert option should be selected and then a required item should be selected on the displayed list. The block which represents the given option will be pasted between the operations connected by the given connector.
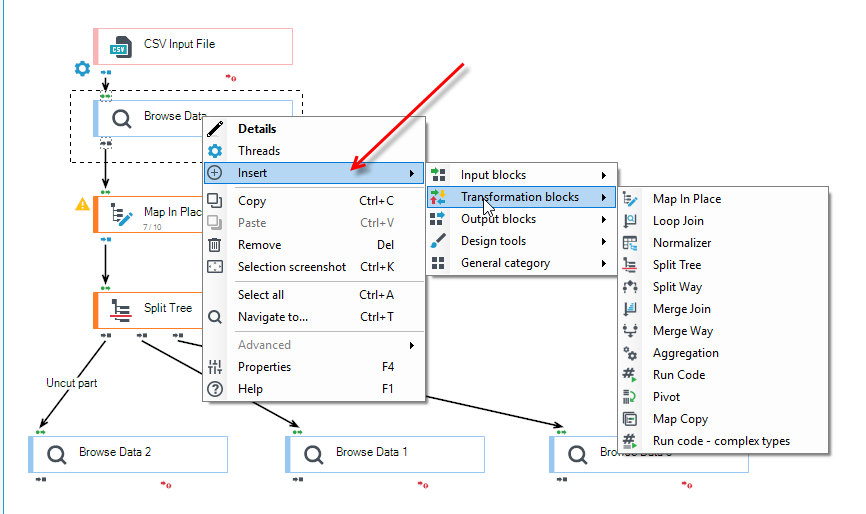
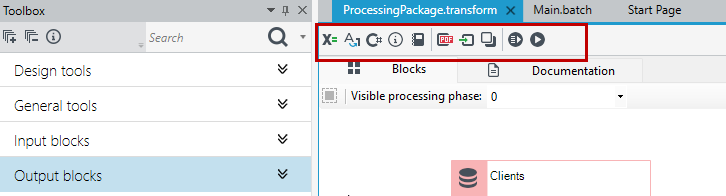
A toolbar of the tab has been equipped with a series of functions which allow:
- deleting selected elements,
- undoing changes,
- redoing changes,
- automatic arrangement of elements on a plane,
- setting the visible processing phase,
- changing views.
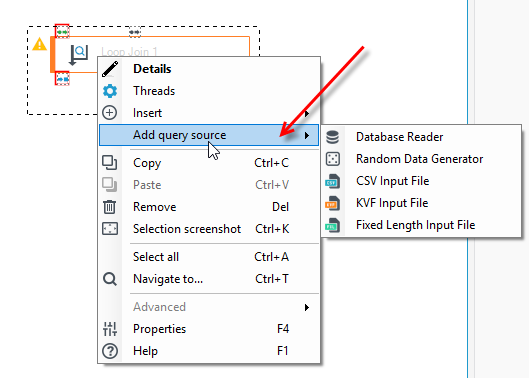
Additionally, there is a context menu on the Loop join block which allows selecting a query source.
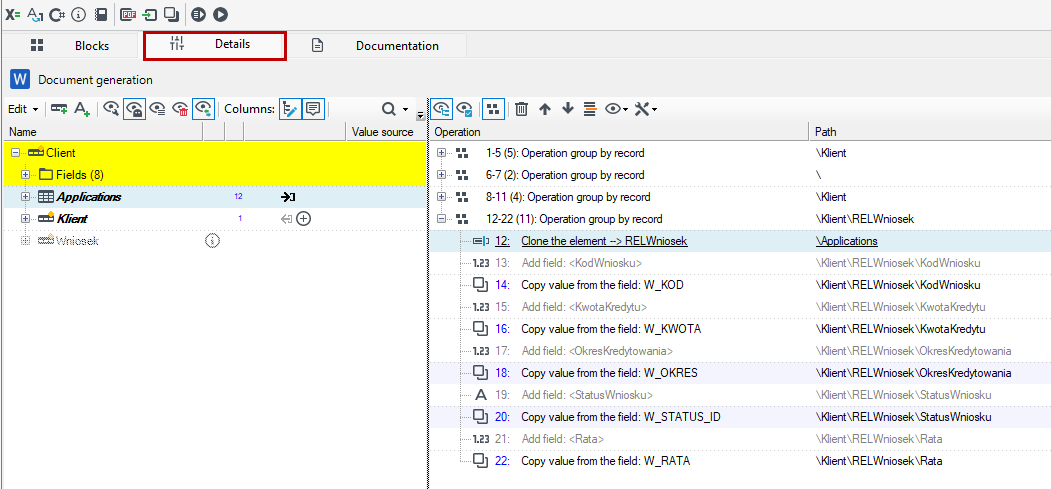
Details tab
It is used for setting operation parameters executed by particular system blocks.
The tab windows may differ and depend on the kind of the block which the details concern.
Report tab
After running a package, the System creates a report of its activities. Therefore, the tab will be displayed only after the Run package action.
A report contains data about the parameters of the completed process and informs about the number of records passing through the given block and their times (i.e. package duration time, command execution time, etc.)
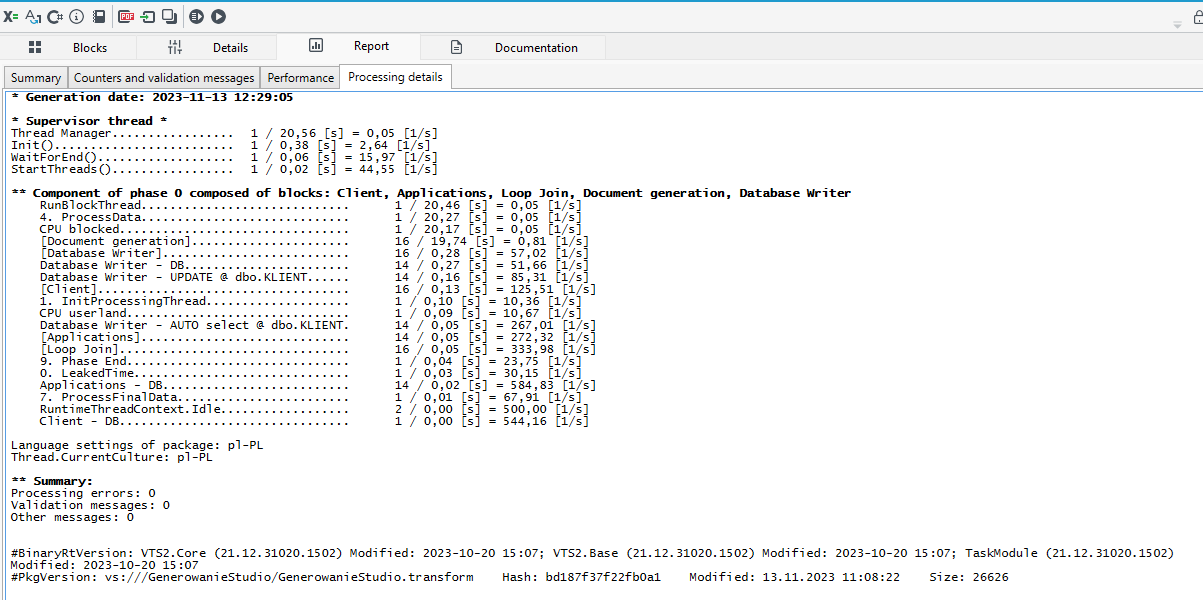
In this case, the Report tab displays very detailed information which sums up:
- package duration time divided into threads and blocks,
- execution times of particular SQL commands classes,
- a counter of counting blocks (classifier, preview, bin, profiler),
- error messages and warnings.
It is important to verify the number of errors in the "Processing errors" line.
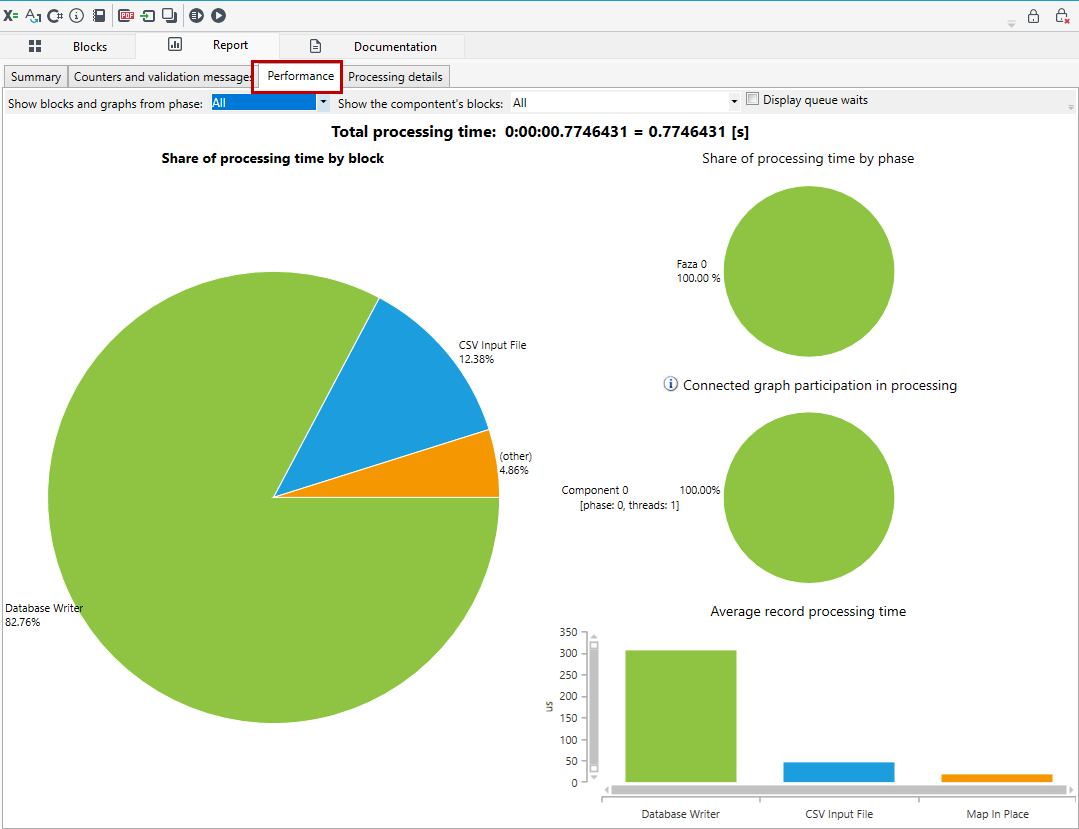
The Performance tab displays the charts of duration and operation speed of particular package elements which helps to identify performance problems quickly. Chart source data may come from (like the Report tab’s content) the package which has recently been run locally or from the analysis of the text performance log loaded from the text file, a clipboard (the “Package” menu) or a task currently connected by the TASKS table.
The charts displays most problematic elements from each domain, which are respectively:
- duration of processing phases,
- block participation in the total processing time (in the form of a pie slice or several bars),
- processing speed in blocks.
Charts with blocks enable going to the specified element after clicking on the appropriate chart area.
Note that, the slowest block does not have to be the longest lasting block – there are very often many branches which process different numbers of records.
Documentation tab
In the main menu (top menu), the System generates documentation of the currently created processing package and it includes the list of blocks used while creating transformation paths. Documentation informs about the name and the kind of a block and also about messages for particular blocks entered by the User in the Details editor.
The second window is a form for entering notes and comments for the entire package. A HTML editor which enables formatting text and inserting objects is used for editing the tab content.
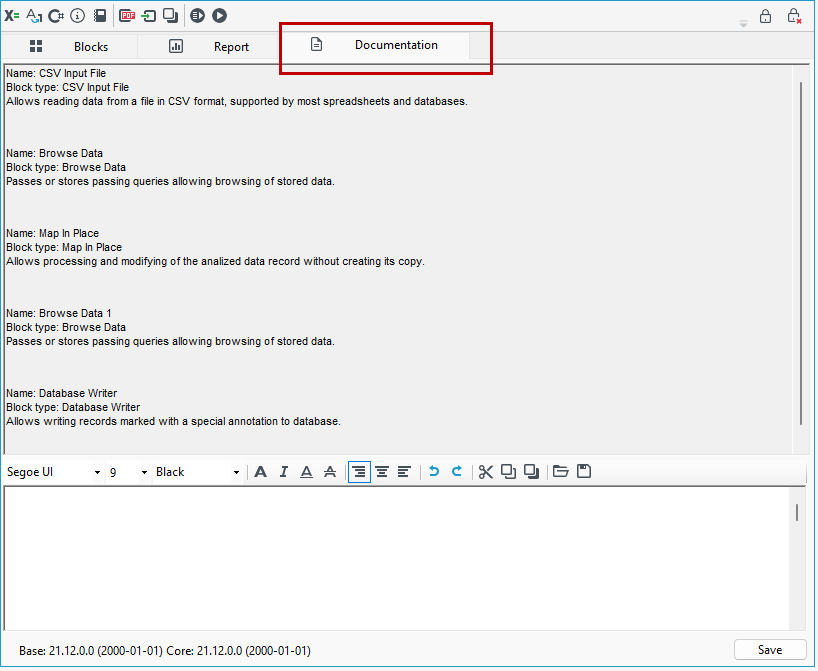
A comment inserted for the package is not visible in the generated package documentation.
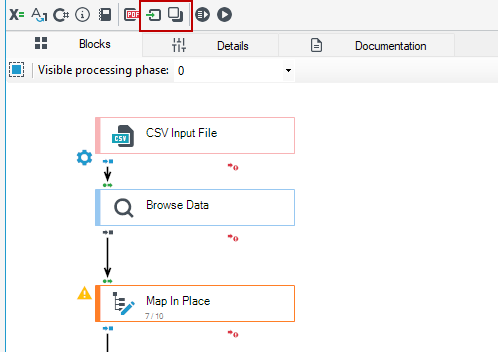
Data Flow Designer also provides a function for analyzing logs of processing execution. Data connections (synchronous and queues) are supplemented with counters of passing records and average queue load, and error reports with the number of reported erroneous records.
Navigating between blocks and the Tabs panel
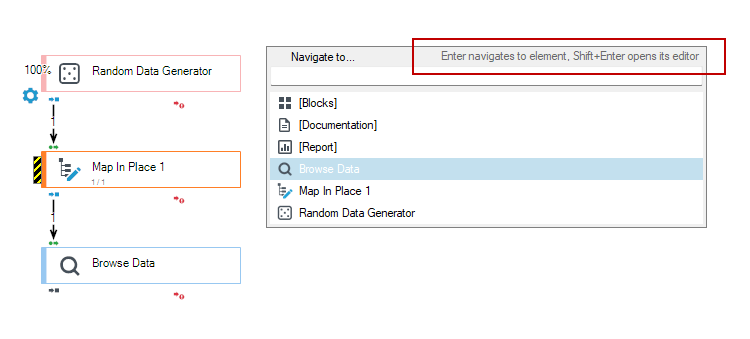
- To quickly and easily switch between blocks and the Tabs panel, use the Navigate to option (Ctrl+T) in the context menu.
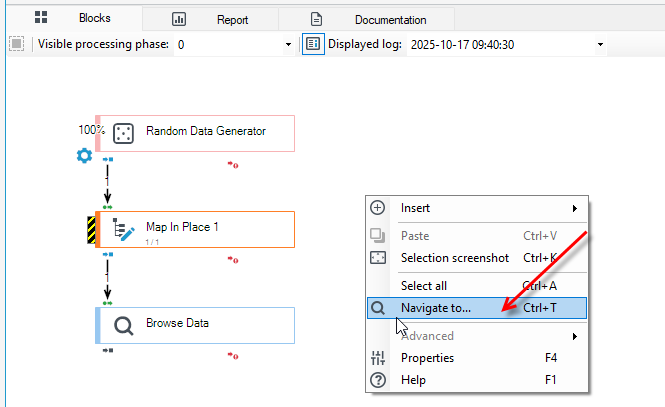
Then, to go to a given element, select the block from the list and press Enter, and to go to the block editor, press Shift+Enter.
SQL Task Editor
SQL task editor - (differently - files .txt, .sql .txt, no extensions) is used for Package SQL Queries, reports, quick file reading and quick data copying.
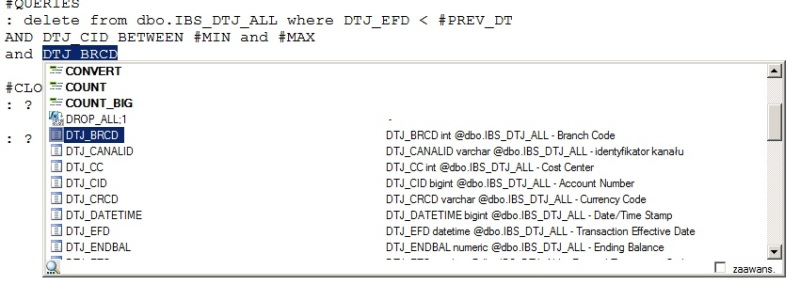
- In most places in the System which require writing complex formulas (value calculation, SQL, regular expressions) there is the smart syntax prediction function which may be activated using the Ctrl+Space keys (see: Syntax prediction).
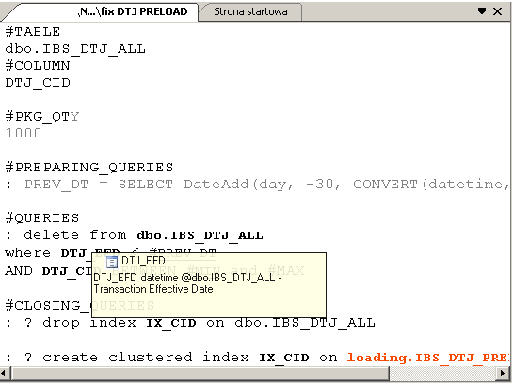
- After hovering a mouse over an SQL fragment (a table name, a column or an alias), a tooltip displaying details of a database object (type, comment) will be displayed.
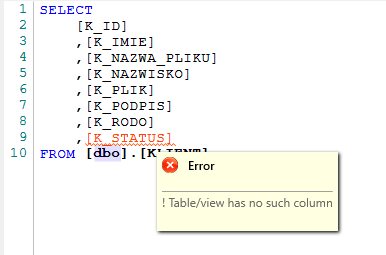
- In case of errors and semantic warnings (e.g. no table/column in a base schema, a warning about the lack of index when searching data) an appropriate query fragment will be colored red and a tooltip will display information about an error.
Keyboard shortcuts:
- Ctrl-Space – enables syntax prediction,
- Ctrl-A – selects entire text in the editor,
- Ctrl-Shift-A – selects one section only (a single SQL).
The scripting language syntax may be generally described in the following way:
#SECTION1
Script fragment
#SECTION2
1: Script fragment
2: Script fragment
#AnotherSection
…
Different task use different sections for their own purposes. For example, the simplest Package SQL script may look like this:
#PREPARING_QUERIES
: drop table TMP_CURR_MIRROR_CLI
In this form, many additional script capabilities, such as the title SQL execution "packaging", are not used - table name, key name, the number of packs etc. are not given.
Note that the script fragments are not numbered.
Some tasks define their own SQL syntax extensions, such as:
- Getting the value from the
SELECTquery and writing it to a task parameter so that it can be used in the next tasks. - Inserting the task parameter value as an SQL parameter
e.g. #(ParameterN)#
3. Inserting the task parameter value as text (so it may occur as a table name fragment)
e.g. ##(ParameterN)#
More information may be found in the chapters on the detailed descriptions of particular tasks - see: A detailed description of tasks.
Data Schema Editor
Data schema editor – is used for previewing and editing schemas (.schema files) with descriptions.
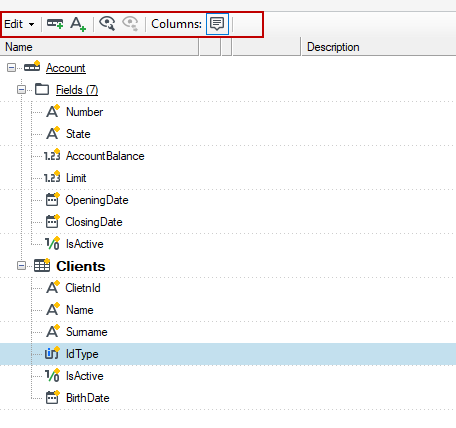
- Allows to edit data schemas which may be used later as e.g. required templates, data structure fragments while processing etc.
- The main editor contains a schema tree where fields and records may be added/removed and annotations may be inserted/removed. It is also possible to insert entire fragments of other schemas from files (the Load button) - from the external file or a pattern (the contents of a template directory).
- For more details, see the chapter on the general possibilities of schema editing (see: Data schema).
Context-sensitive help windows (tooltips)
Such windows are displayed in several places of the design environment and allow quick preview of the most important properties of the displayed elements, documentation fragments, user descriptions and even the full context-sensitive help.
They may be "pinned" on the screen and hidden if necessary using the "pin" button in the top right window corner.
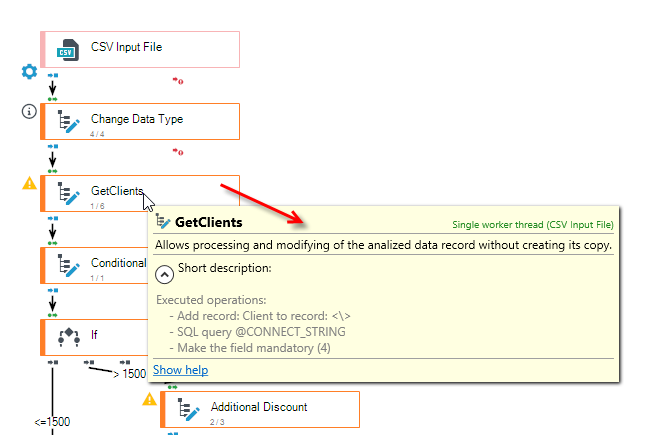
Task tooltips display:
- short characteristics of the task content - a text description on the basis of the dependencies network fragment: the operation (e.g. SQL), input and output objects.
- for tasks being performed/performed: time characteristics (times, status).
Tooltips for processing blocks in the execution mode or after loading logs display:
- Time characteristics (number of invocations, duration time, average speed). The 'hottest' blocks are also marked with a black-yellow warning bar which size is proportional to the percentage of contribution to the summary serial processing time.
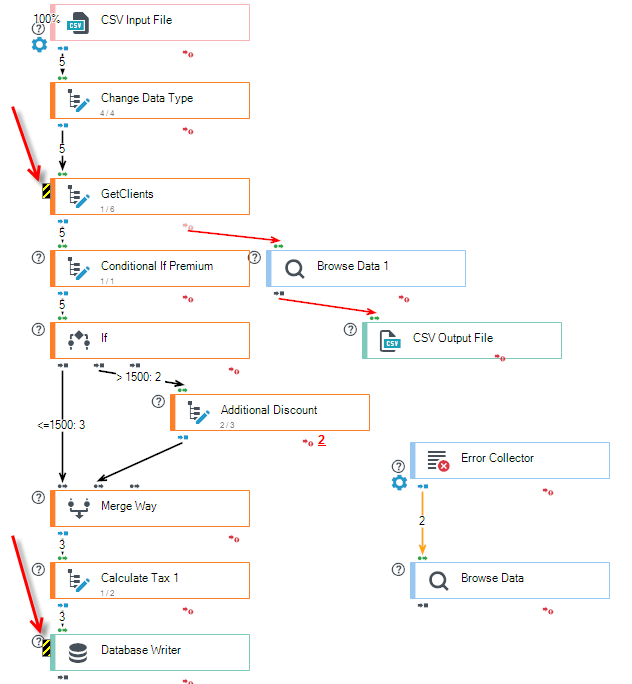
- A short statistics of detected errors.
- The details of measurements associated with the block - e.g. the details of times of record fragments write to databases - external invocations of MD models, etc.
Searching in processing packages
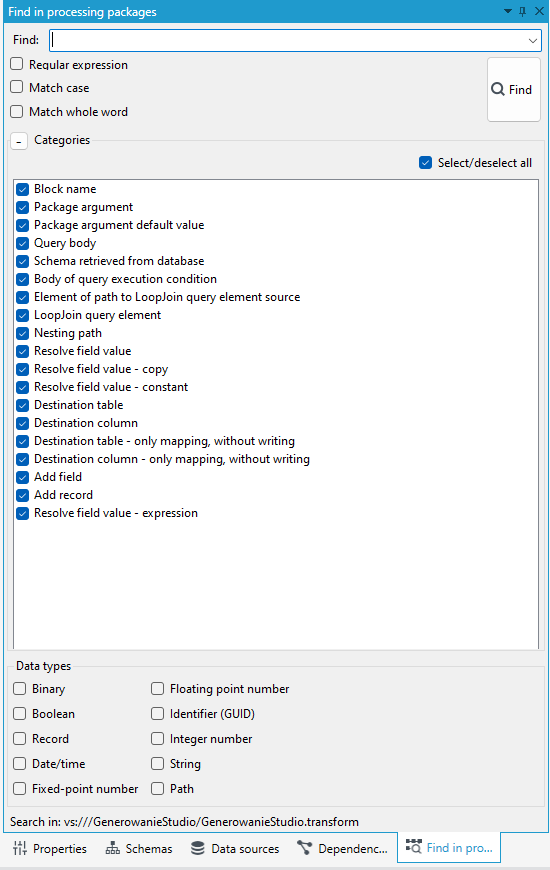
Option Find in processing packages allows you to search an active document for all subtitles in it (block names, text data in blocks).
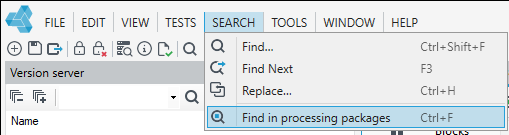
- Select Search>Find in processing packages from the main menu.
- An additional panel Find in processing packages will be activated, where you can enter search criteria: regular expression, case sensitive, whole words.
- The panel (or more often an undocked window) enables searching an active document. When entering a desired expression in the Find field, an item from the list of available strings is auto-completed which makes navigation in the System easier.
- All elements which may be searched in the System have been divided into categories. Clicking the "+" button in the Categories panel will allow searching only within the selected categories. A list with all possible categories to be searched in will be expanded. Categories to be searched in are defined by checking/unchecking the appropriate list items.
- Additionally, for some categories (such as resolving field value) it is also possible to decide on the type of field which searching concerns.
An advanced search option based on regular expressions (Microsoft .NET syntax) is also available. See: Regular expressions.
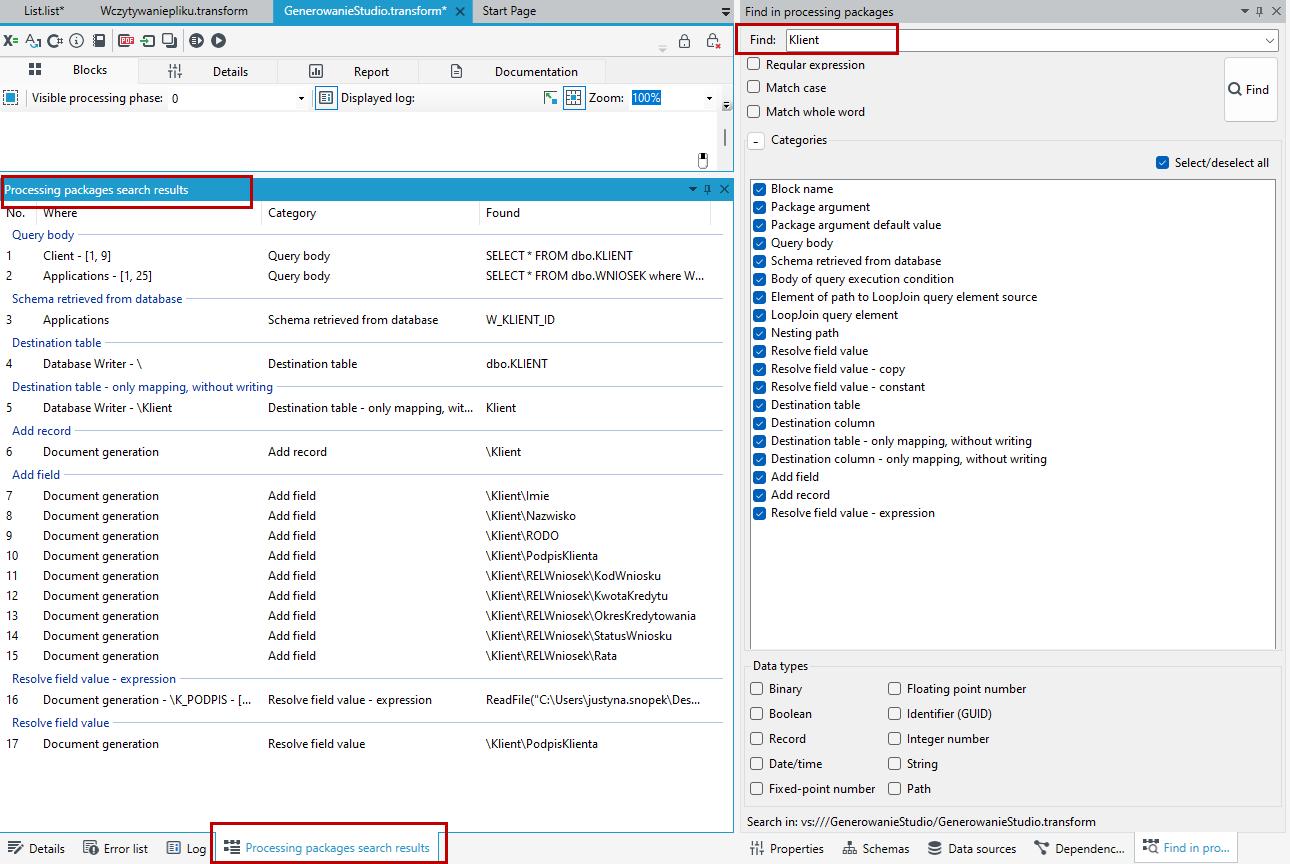
Search results are displayed in the auxiliary panel. The panel displays the search results showing where the searched expression occurs together with the context (distinguishing simple occurrences in text, data schema, calculation operations, formulas, etc.) and the surrounding text. Double clicking the row in the panel moves to the place where the element occurs.
Log tab
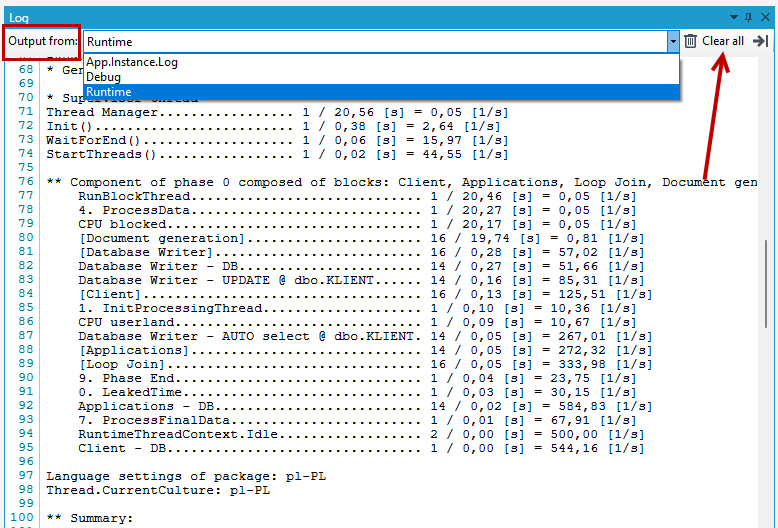
The Log panel - usually displayed at the bottom of the screen, provides a chronological record, containing information about events and actions concerning the system.
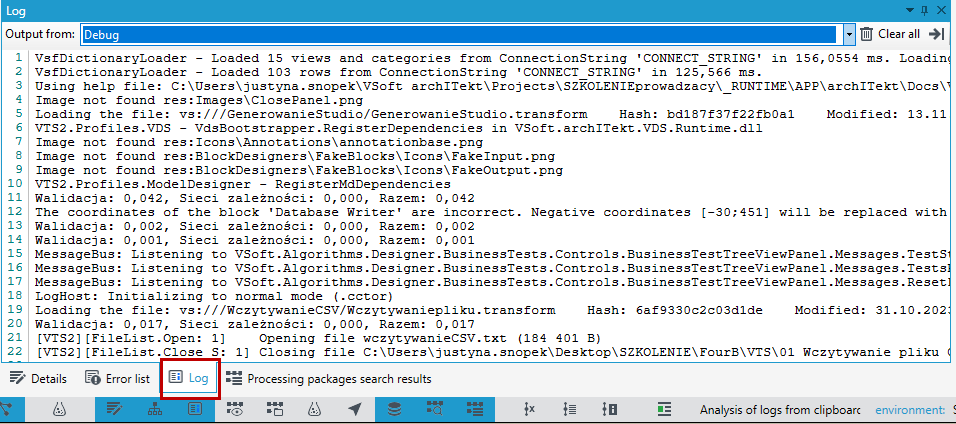
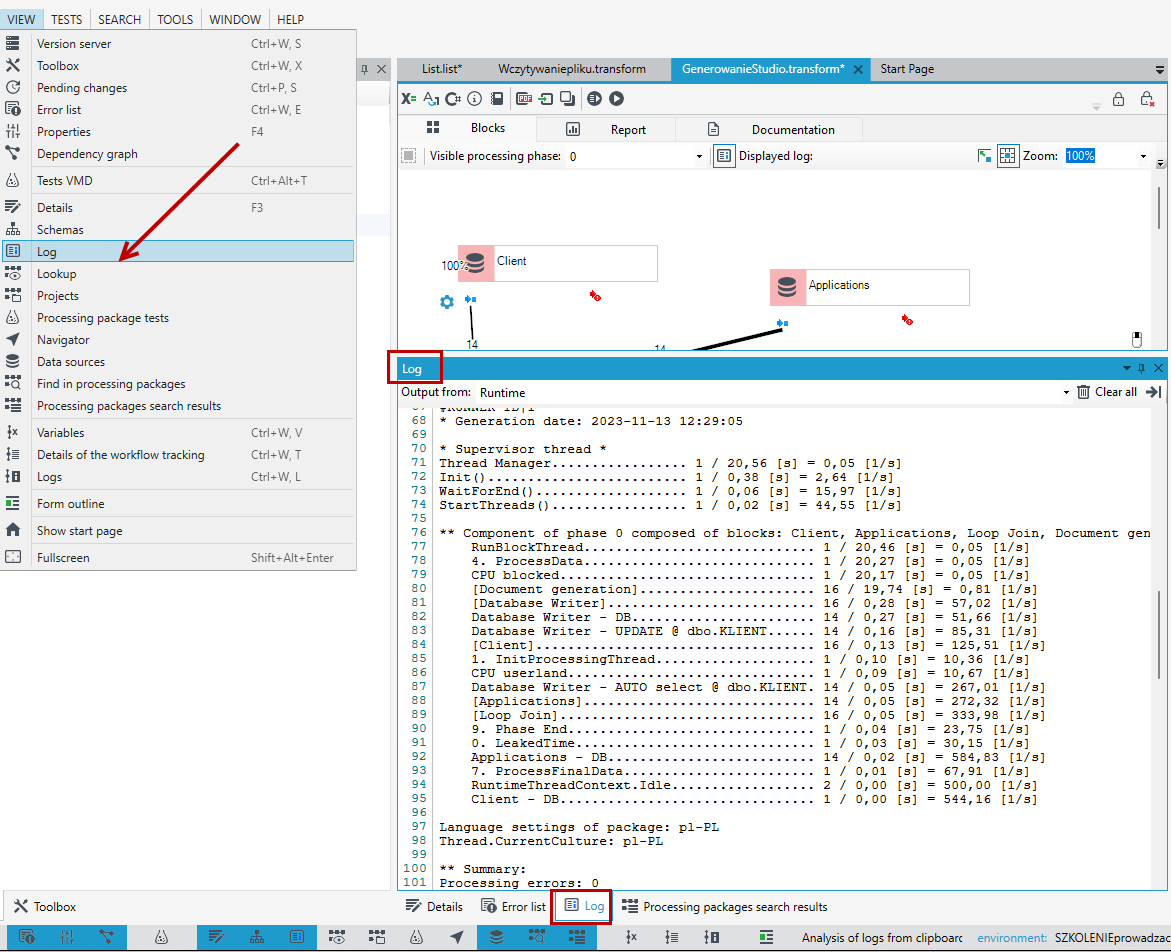
- If the panel is not visible, select Log from the View main menu to enable the panel, or select the icon
 from the bottom bar.
- You can choose which component the information should relate to (and from which component it should come) by selecting it from the drop-down list.
- To remove log records from the tab list, select the Clear all button.