Dependency Analyzer
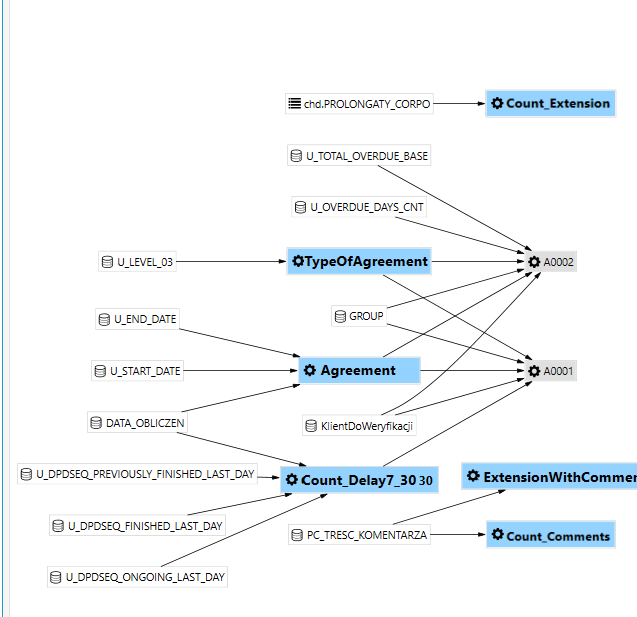
The archITekt platform is equipped with a dependency analyzer. This tool is extremely helpful for building and handling data. It shows connections, dependencies, occurring between variables or rules and their direction graphically.
An example of a complex dependency network tree in the analyzer.
- To display the analyzer window, select Dependency graph from the View menu or the icon
 from the bottom menu.
Markings on Dependency graph - symbols:
 - Indicates an element of the data space. Note here that under specific conditions, this symbol can also denote a single transformation operation. This happens, for example, when we cut off with the help of cavity level adjustment the transformations associated with this aggregate. Then it is treated as an element of the data space.
 - Means a single transformation operation (single aggregate).
 - Means a multiple record (e.g.: List).
 - Indicates a linkage, where the arrowhead indicates the input to the element.

Indicates an element of the data space. Note here that under specific conditions, this symbol can also denote a single transformation operation. This happens, for example, when we cut off with the help of cavity level adjustment the transformations associated with this aggregate. Then it is treated as an element of the data space.

Means a single transformation operation (single aggregate).

Means a multiple record (e.g.: List).

Indicates a linkage, where the arrowhead indicates the input to the element.
Highlight colors:
- White - variable
- Blue - rule (function)
- Gray - rule linked from another table
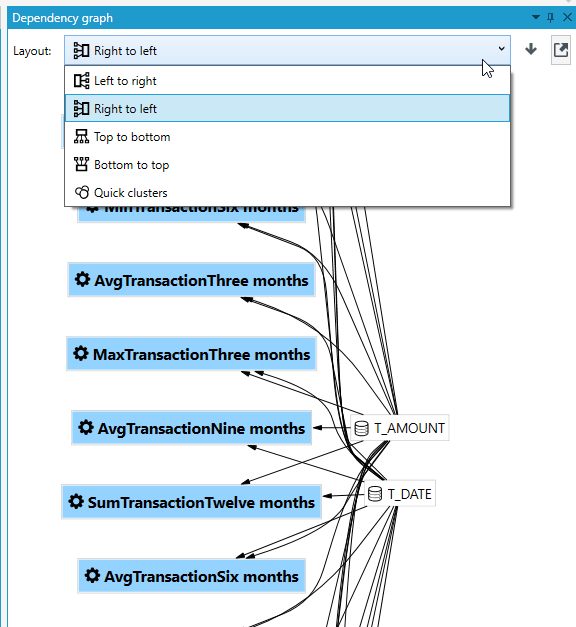
It is possible to configure the view of the dependency flow in the dependency graph.
Depending on the selection:
- Left right - dependencies are presented graphically from left to right (default layout)
- Right left - dependencies are presented from right to left
- Top bottom - dependencies are presented from top to bottom
- Bottom top - dependencies are presented from bottom
- Quick clusters
In addition, there is an arbitrary possibility to place the elements manually. You should click the mouse on the selected element and move it to any place. The length and direction of the arrows connected to the element will be automatically adjusted to the new location.
Depth level
All elements of the decision-computing engine (models, decision trees, mappings, formulas, etc.) are subject to continuous analysis so that at any time it is possible to visualize the forward and backward dependencies (lparent depth and children depth) for each data element. In other words, we can straightforwardly find out where the considered field is getting its values from and where they are further used. The analyzer gives us the option to choose how deep (how many levels up or down) to display these relationships. To edit, select the appropriate option:
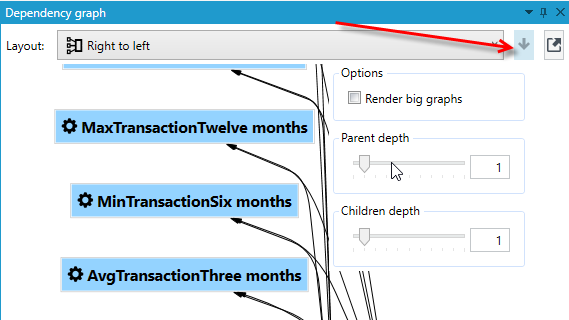
The limit of the maximum depth is 10 levels up or down.
If a variable or rule appears in the analyzer, which is not visible in the currently edited table, it is possible to automatically switch to the file with its definition. To do this, double-click with the left mouse button on the item. In the middle working window, the array in which the rule is defined will appear, and the dependency network will change showing now the dependencies for the selected rule or variable.
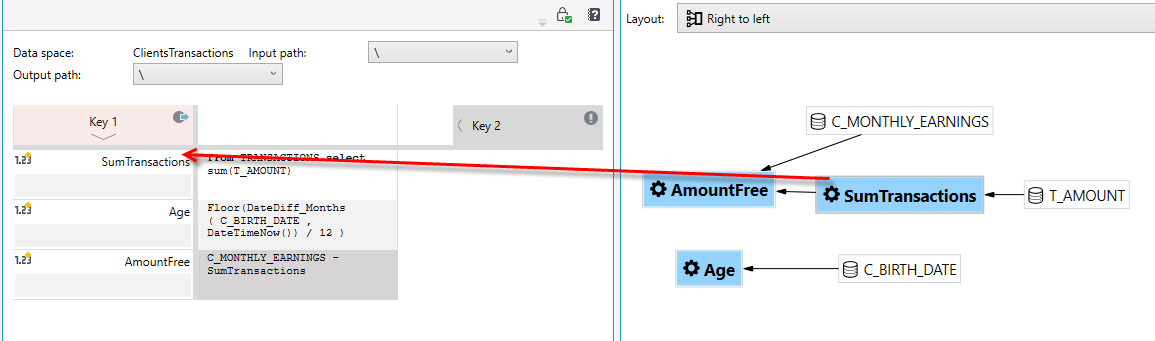
Cycle in the analyzer
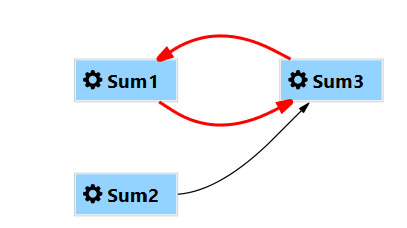
Cycle - (from graph theory) is a closed path, with the same last and first vertex. In addition, this path can have the same vertex multiple times, including in a row - in the case of so-called loops. A simple cycle is a special (simpler) case of a cycle.
The dependency analyzer is able to detect undesirable occurrences of cycles. This is indicated by red arrows (as in the image above).